
Australia’s Power Generation Mix 2006-2015
Over the past decade there has been a very significant change in the sources of power generation used to supply electricity customers in South Australia (SA), and the SA experience has been markedly different from the other National Electricity Market (NEM) states of QLD, NSW, VIC & TAS.
Tasmania remains the standout as the state with the lowest carbon emissions intensity of all NEM regions, largely due to it hydro-electric resource endowment. However, the state that has and continues to experience the greatest green transition is South Australia.
Let’s take a look at the change in Australia’s power generation mix over time, state-by-state within the NEM.
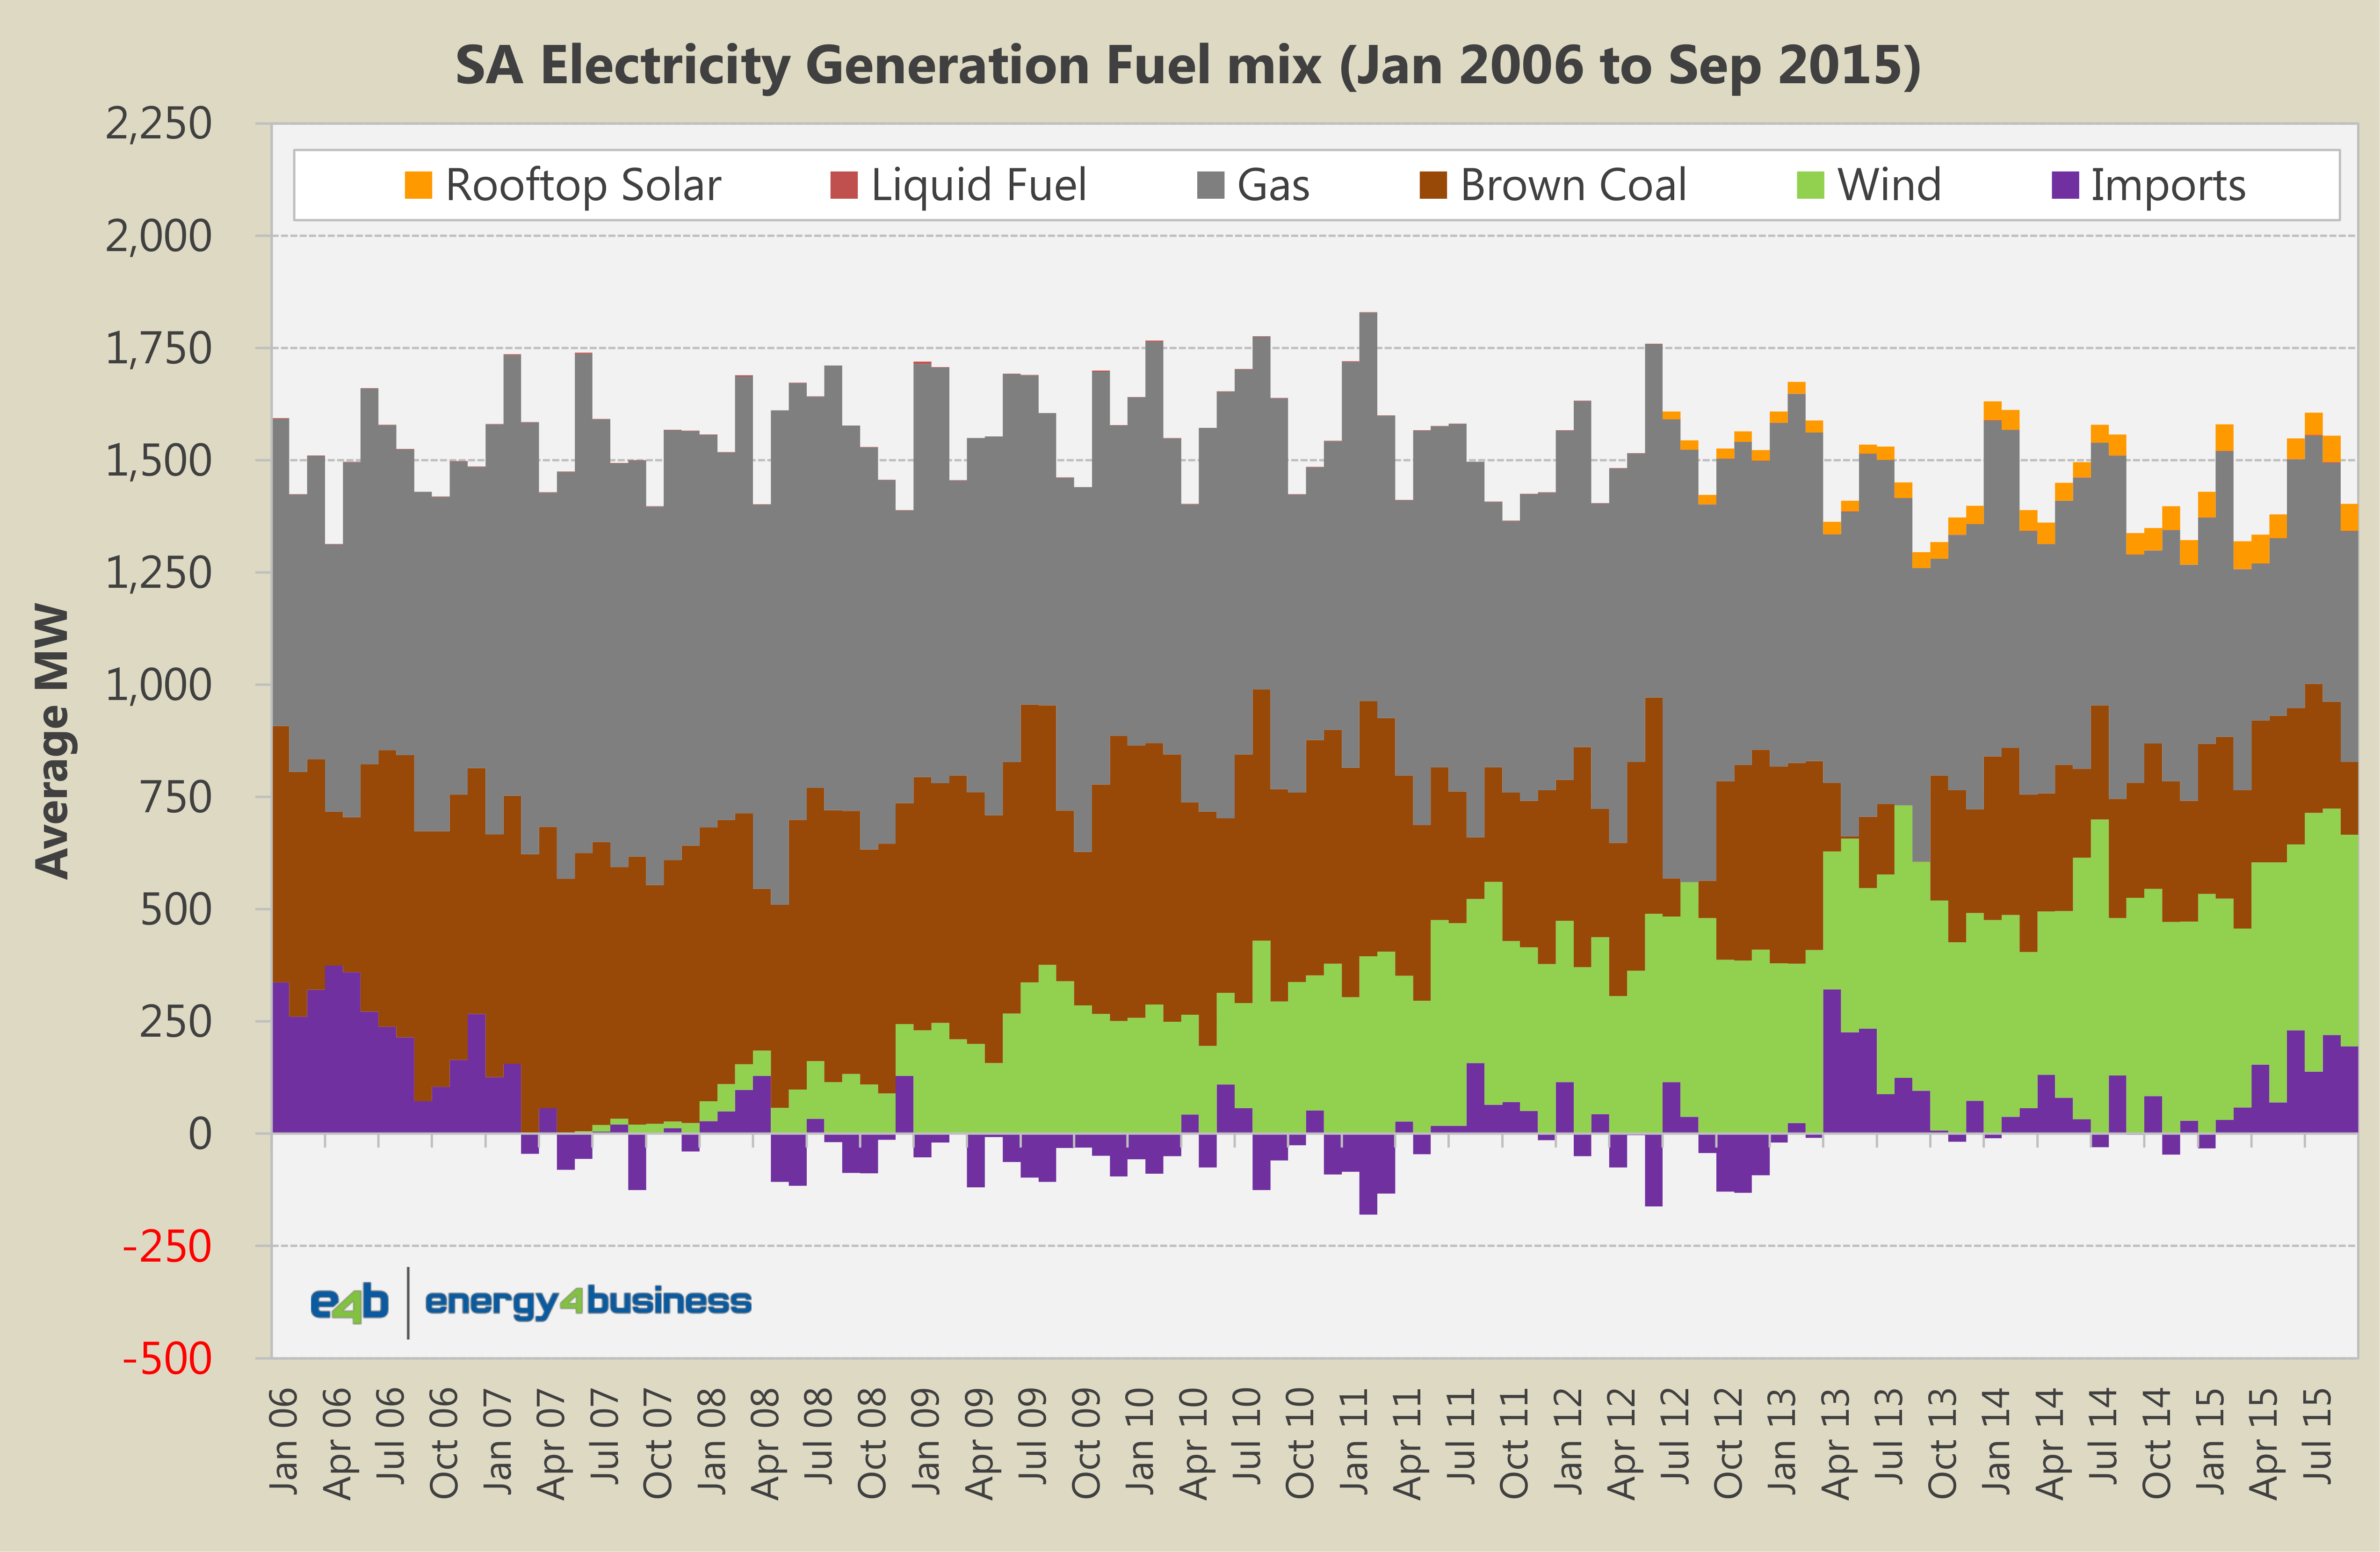
South Australia
2007 saw the appearance and rapid growth of scheduled electricity generation from wind farms in South Australia.
In the prior year, 2006, SA primarily relied upon electricity from:
- Natural gas fired generation for 48% of its electricity;
- Port Augusta Power Stations (burning Leigh Creek brown-coal) for 36%; and
- Imports from Victoria for the remaining 17%.
Source data: AEMO, Creative Analytics, Australian PV Institute, e4b estimates.
Roll forward almost a decade, and in the 12 months ending 30 September 2015, SA’s mix has transformed to:
- Natural gas fired generation dropped to 35%;
- Brown coal down to 21%;
- Imports from Victoria down to 7% (note: months with negative import bars indicates that SA was a net exporter to VIC in that month); with
- Rooftop Solar PV now taking 4% share; and
- Wind farm generation up to 34%.
And looking forward, Alinta Energy has announced that it will close the Leigh Creek Coal Mine in mid-November 2015 and the closure of Augusta Power Stations in March 2016. Consequently, from Q2 2016, South Australia will be the only mainland NEM state without any coal-fired power generation.
As it stands at September 20015, the carbon intensity of SA’s power generation sector is 0.48 tonnes of carbon dioxide equivalent per megawatt hour of electricity (0.48t CO2e/MWh) or approximately one half of the whole NEM average of 0.93t CO2e/MWh.
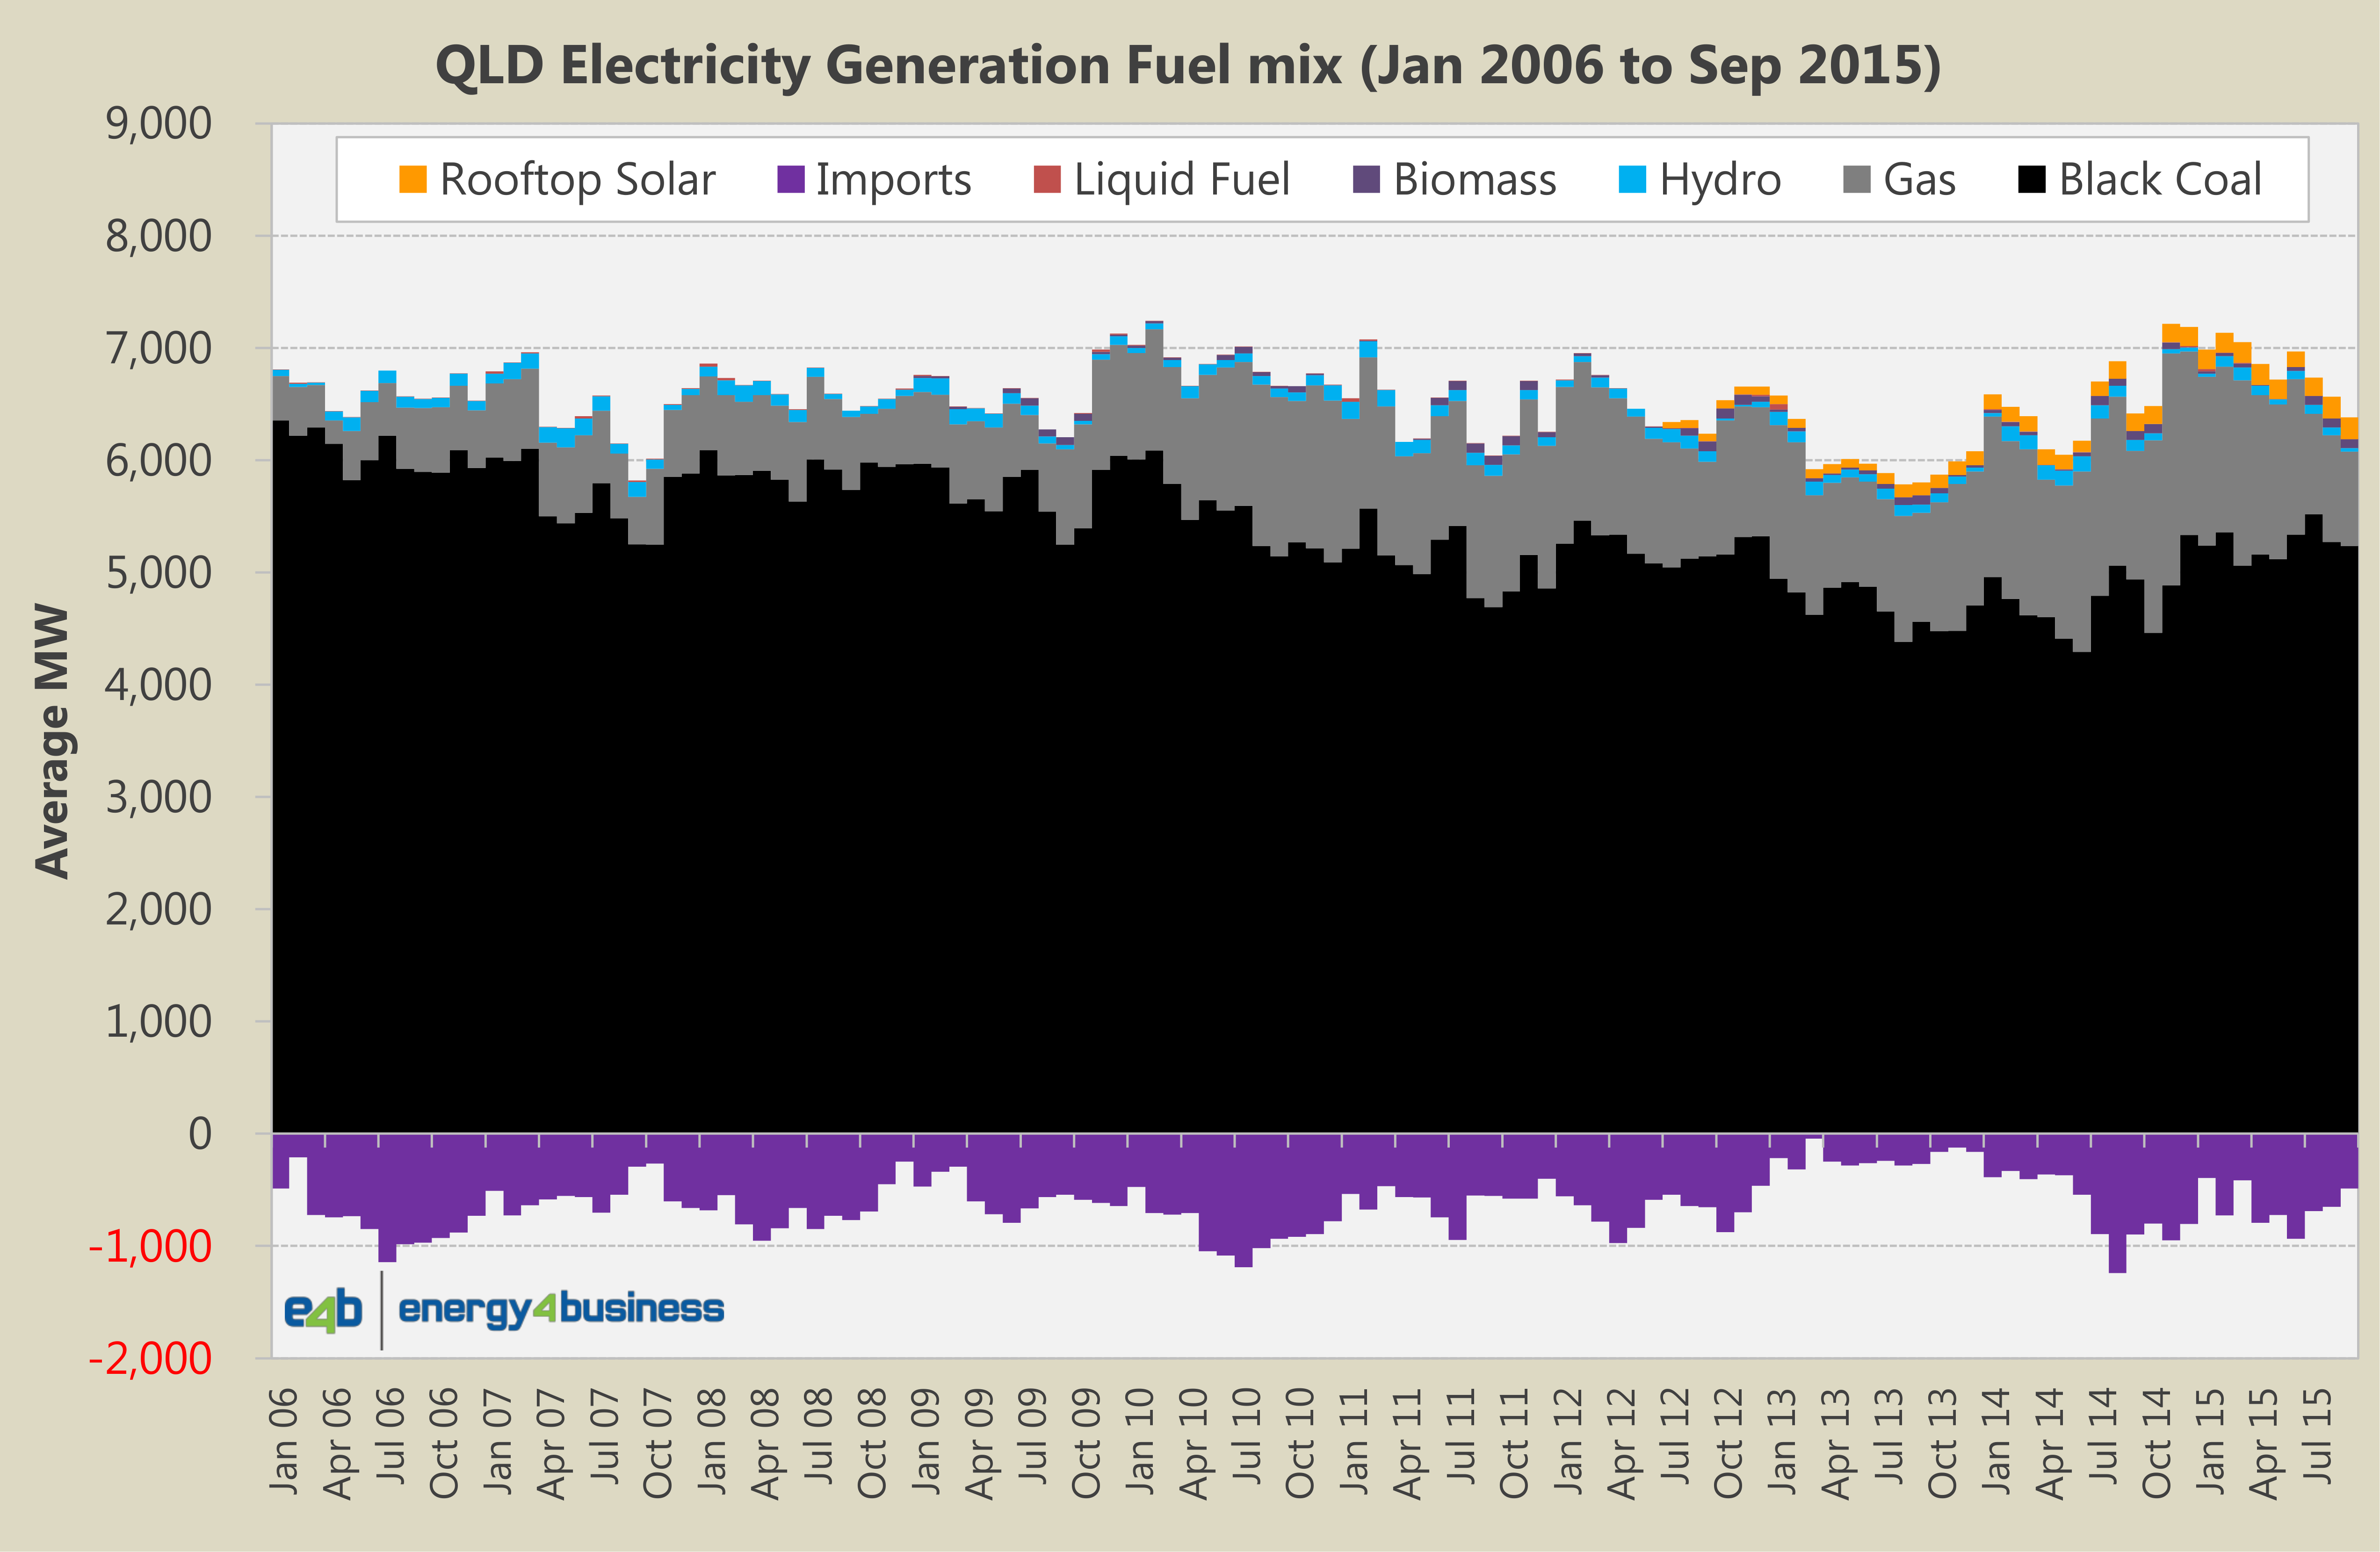
Queensland
The major change observed in QLD over the past decade has been the growth in gas-fired generation, but QLD remains black-coal generation dominant and has remained a net exporter of electricity to its interconnected neighbour, NSW.
In 2006, QLD primarily relied upon electricity from:
- Black coal fired generation for 104% of its electricity demand;
- Natural gas fired generation for 8%;
- Hydro-electric power for 1%; and
- QLD exported 13% of its generation to NSW.
Source data: AEMO, Creative Analytics, Australian PV Institute, e4b estimates.
In the past 12 months, QLD’s mix was:
- Black coal fired generation declined to 84%;
- Natural gas fired generation almost tripled to 23%;
- Hydro-electric power maintained 1%;
- QLD exports to NSW dropped slightly to 11%;
- Rooftop Solar PV is now taking 3% share; and
- Biomass has picked up 1%.
The carbon intensity of QLD’s power generation sector in September 2015 is 0.89t CO2e/MWh compared to the whole NEM average of 0.93t CO2e/MWh.
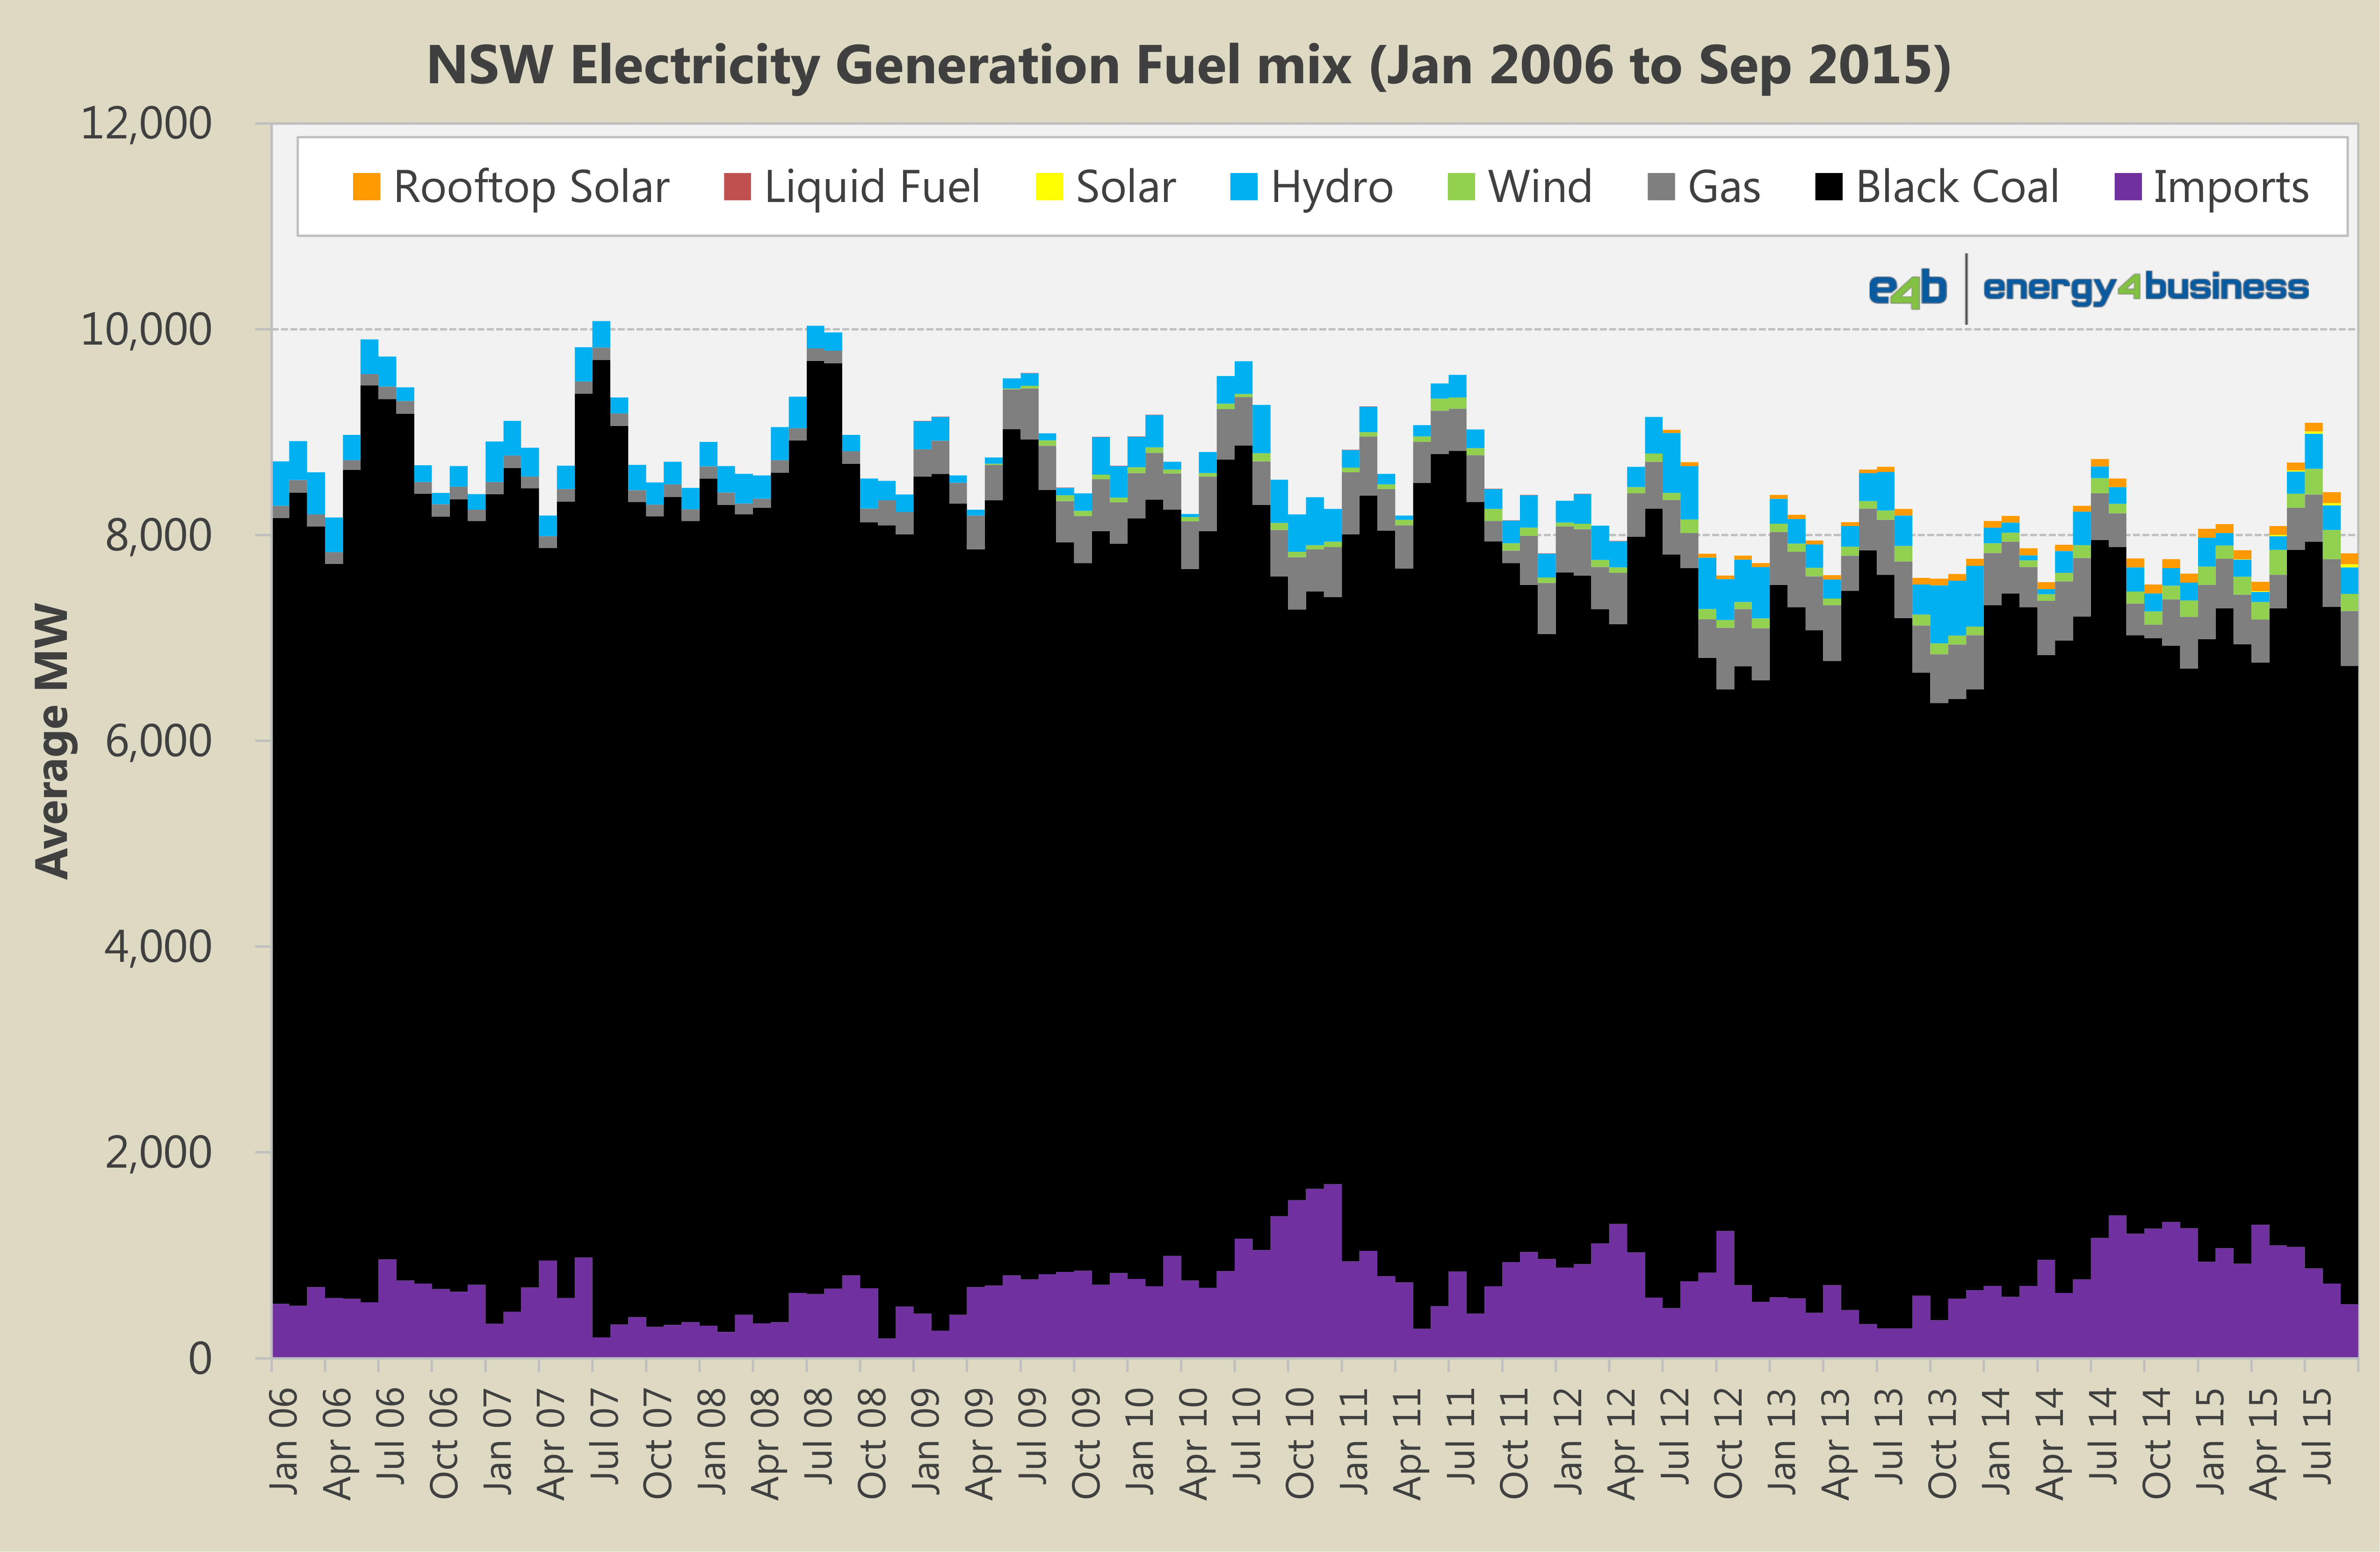
New South Wales
Like QLD, NSW remains black-coal generation dominant. NSW is interconnected to both QLD and VIC and remains a net importer of electricity. NSW has seen growth in gas generation, wind and solar. In terms of solar, NSW has large scale grid connected solar farms coming on-line as well as “behind-the-meter” rooftop solar PV.
In 2006, NSW primarily relied upon electricity from:
- Black coal fired generation for 88% of its electricity demand;
- Imports from QLD & VIC for 7%;
- Hydro-electric power for 3%; and
- Natural gas fired generation for 1%.
Source data: AEMO, Creative Analytics, Australian PV Institute, e4b estimates.
In the past 12 months, NSW’s mix was:
- Black coal fired generation declined to 76%;
- Imports almost doubled to 13%;
- Gas fired generation increased to 5%;
- Hydro-electric power 2%;
- Wind power 2%; and
- Rooftop Solar PV is now taking 2% share.
The carbon intensity of the NSW power generation sector in September 2015 is 0.90t CO2e/MWh compared to the whole NEM average of 0.93t CO2e/MWh.
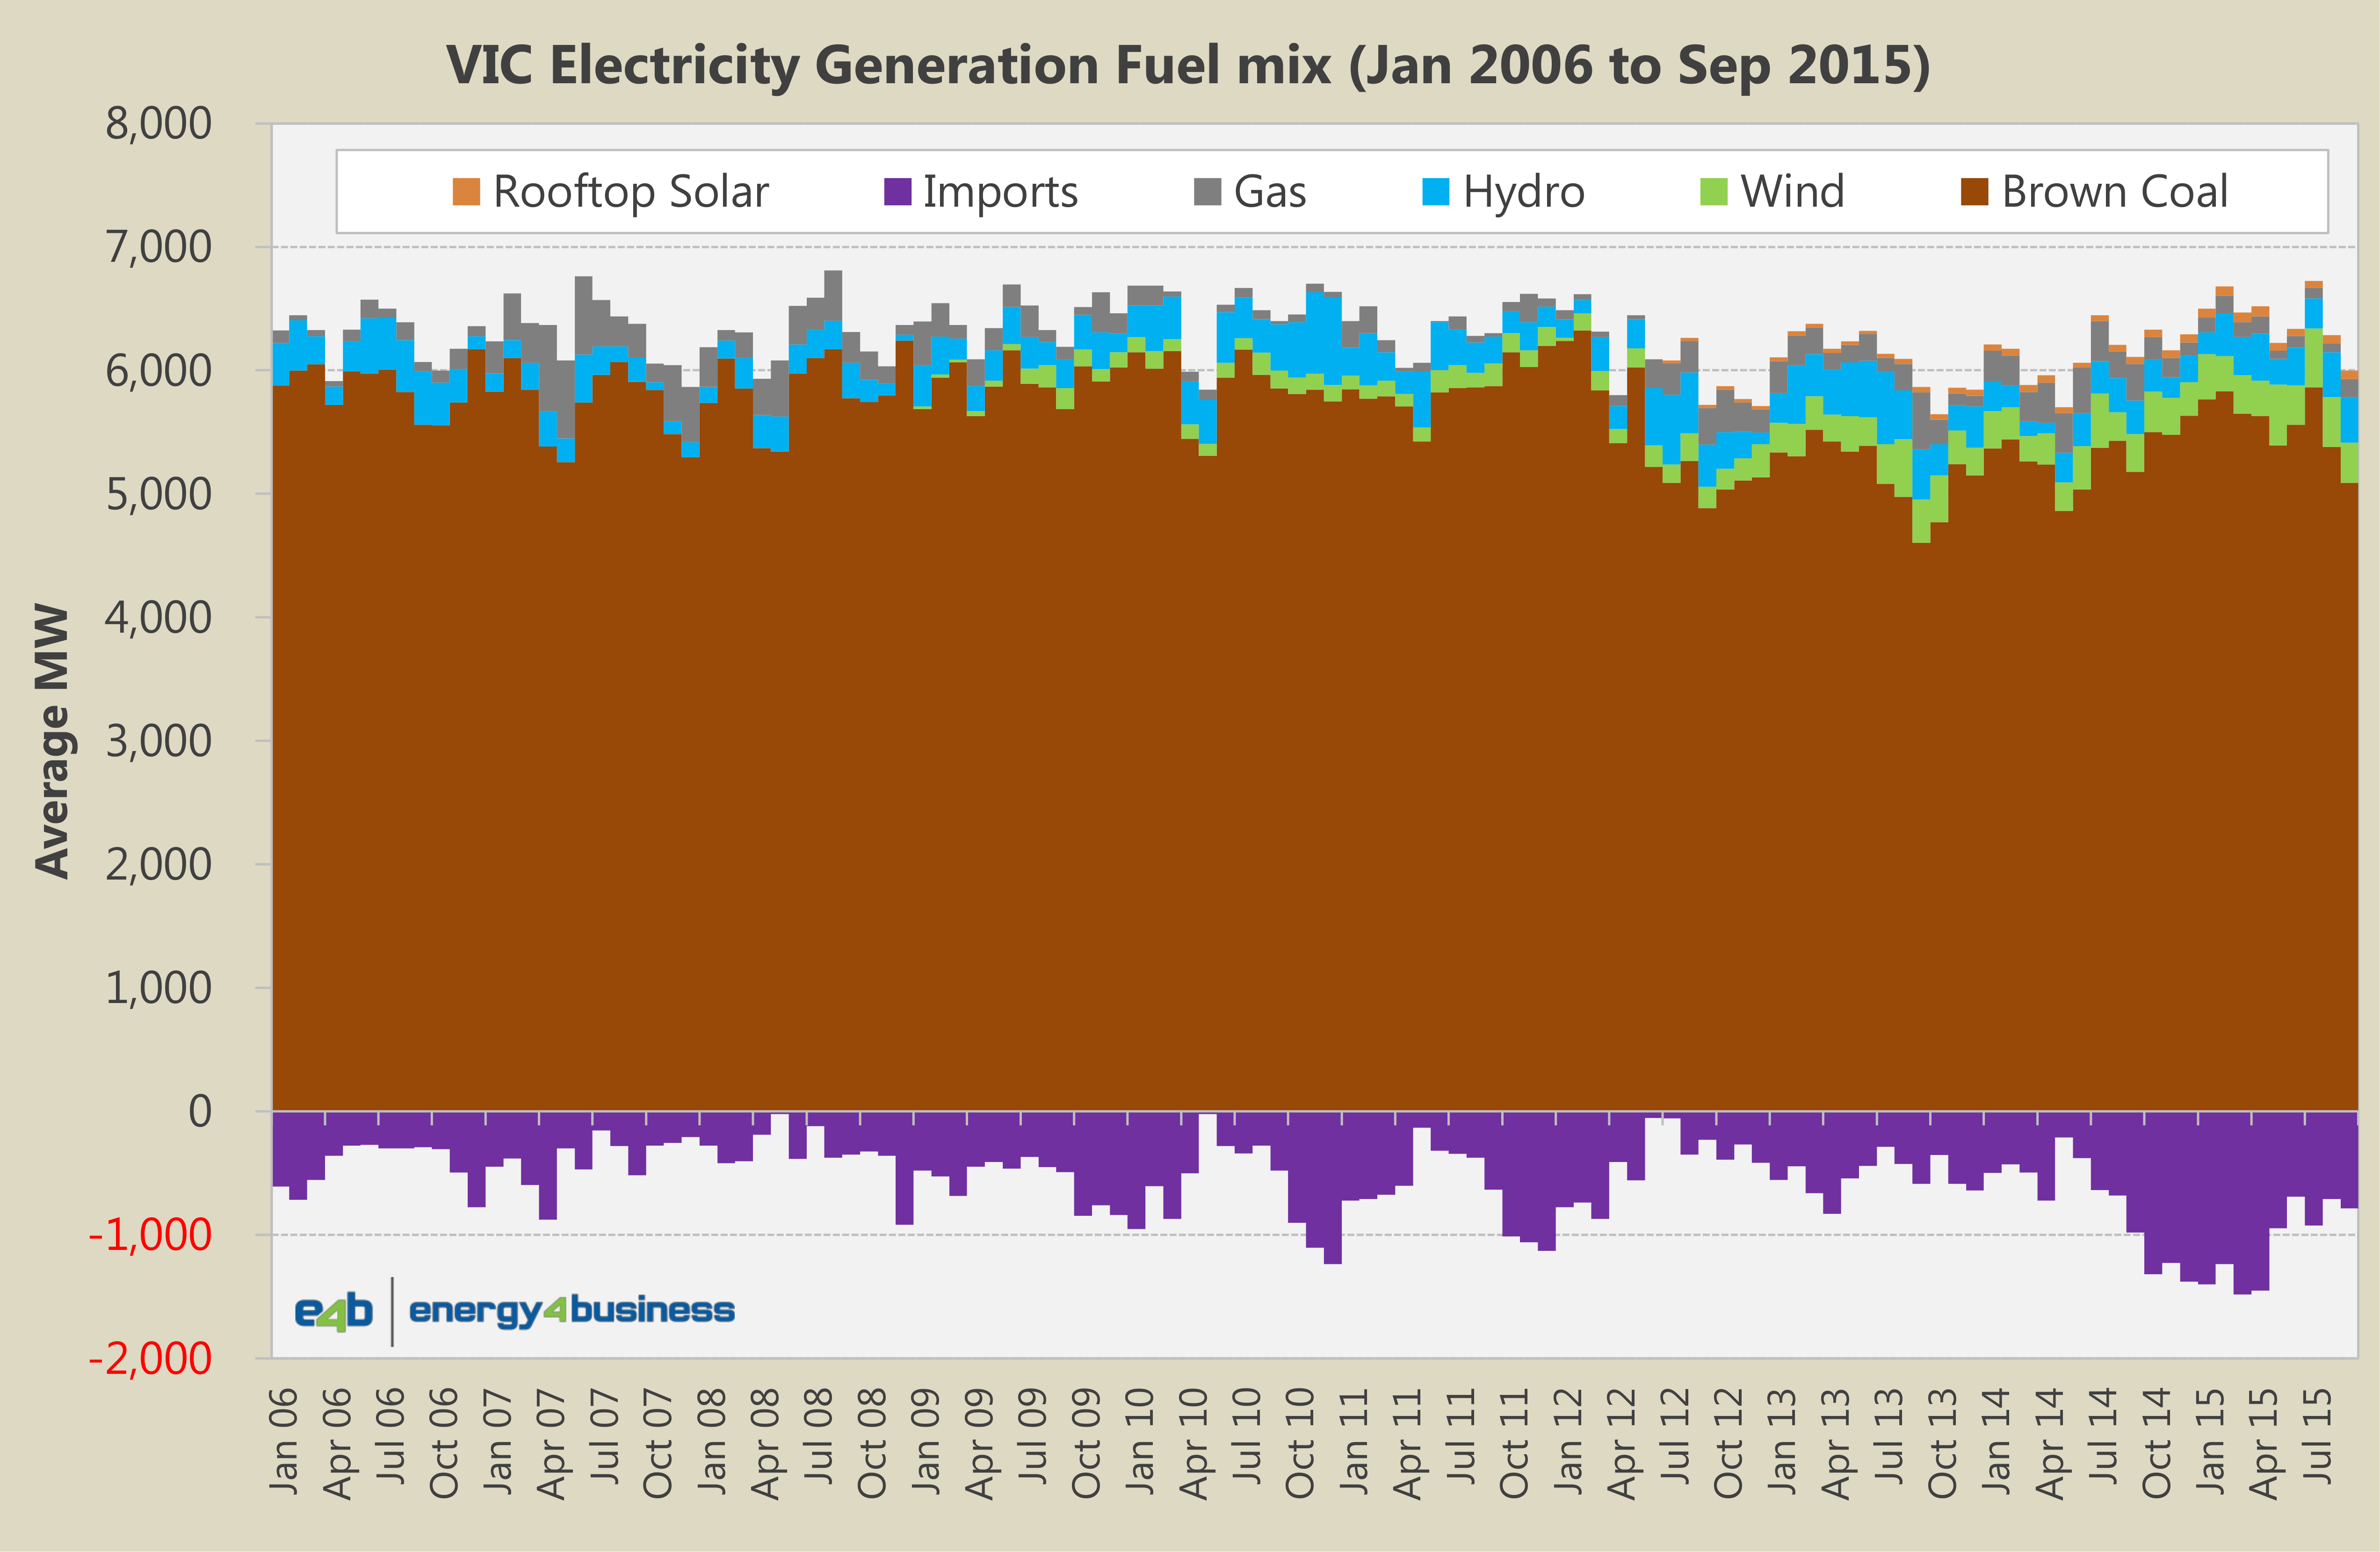
Victoria
Like QLD & NSW, VIC remains coal generation dominant, however, the primary fuel source in VIC is brown coal rather than black. VIC is interconnected to NSW, TAS & SA and is increasingly a net exporter of electricity. Those exports have increased since the removal of the carbon tax in July 2014 and had been somewhat lower through the 24 months of the carbon tax from July 2012 to June 2014.
VIC has seen growth in brown coal, wind and solar.
In 2006, VIC primarily relied upon electricity from:
- Brown coal fired generation for 100% of its electricity demand;
- Hydro-electric power for 5%;
- Natural gas fired generation for 2%; and
- VIC exported 8% of its generation to NSW, TAS & SA.
Source data: AEMO, Creative Analytics, Australian PV Institute, e4b estimates.
In the past 12 months, VIC’s mix was:
- Brown coal fired generation increased to 106%;
- Gas fired generation was steady at 5%;
- Hydro-electric power was steady at 2%;
- Wind power has grabbed 7%;
- Rooftop Solar PV is now taking 1% share; and
- Exports have tripled to 22%.
The carbon intensity of the VIC power generation sector in September 2015 is 1.20t CO2e/MWh compared to the whole NEM of 0.93t CO2e/MWh.
Tasmania
Tasmania’s electricity supply remains dominated by hydro-electric power and switches between net imports and net exports with VIC. Wind is also increasing its share in TAS. TAS is interconnected to VIC, and in the earlier part of the past decade TAS was a net importer from VIC. During the 2 years of the carbon tax, TAS was exclusively a net exporter to VIC on a monthly basis. Of recent times, TAS has been a net importer during warmer months and a net exporter during cooler months.
In 2006, TAS primarily relied upon electricity from:
- Hydro-electric power for 85%; and
- Imports for 15%.

Source data: AEMO, Creative Analytics, Australian PV Institute, e4b estimates.
In the past 12 months, TAS’s mix was:
- Hydro-electric power was steady at 85%;
- Imports declined to 4%;
- Wind power has grabbed 10%; and
- Rooftop Solar PV is now taking 1% share.
The carbon intensity of the TAS power generation sector in September 2015 is 0.0t CO2e/MWh compared to the whole NEM of 0.93t CO2e/MWh.