
Australia’s Power Generation Mix 2006-2016
Australia’s power generation mix continues to evolve.
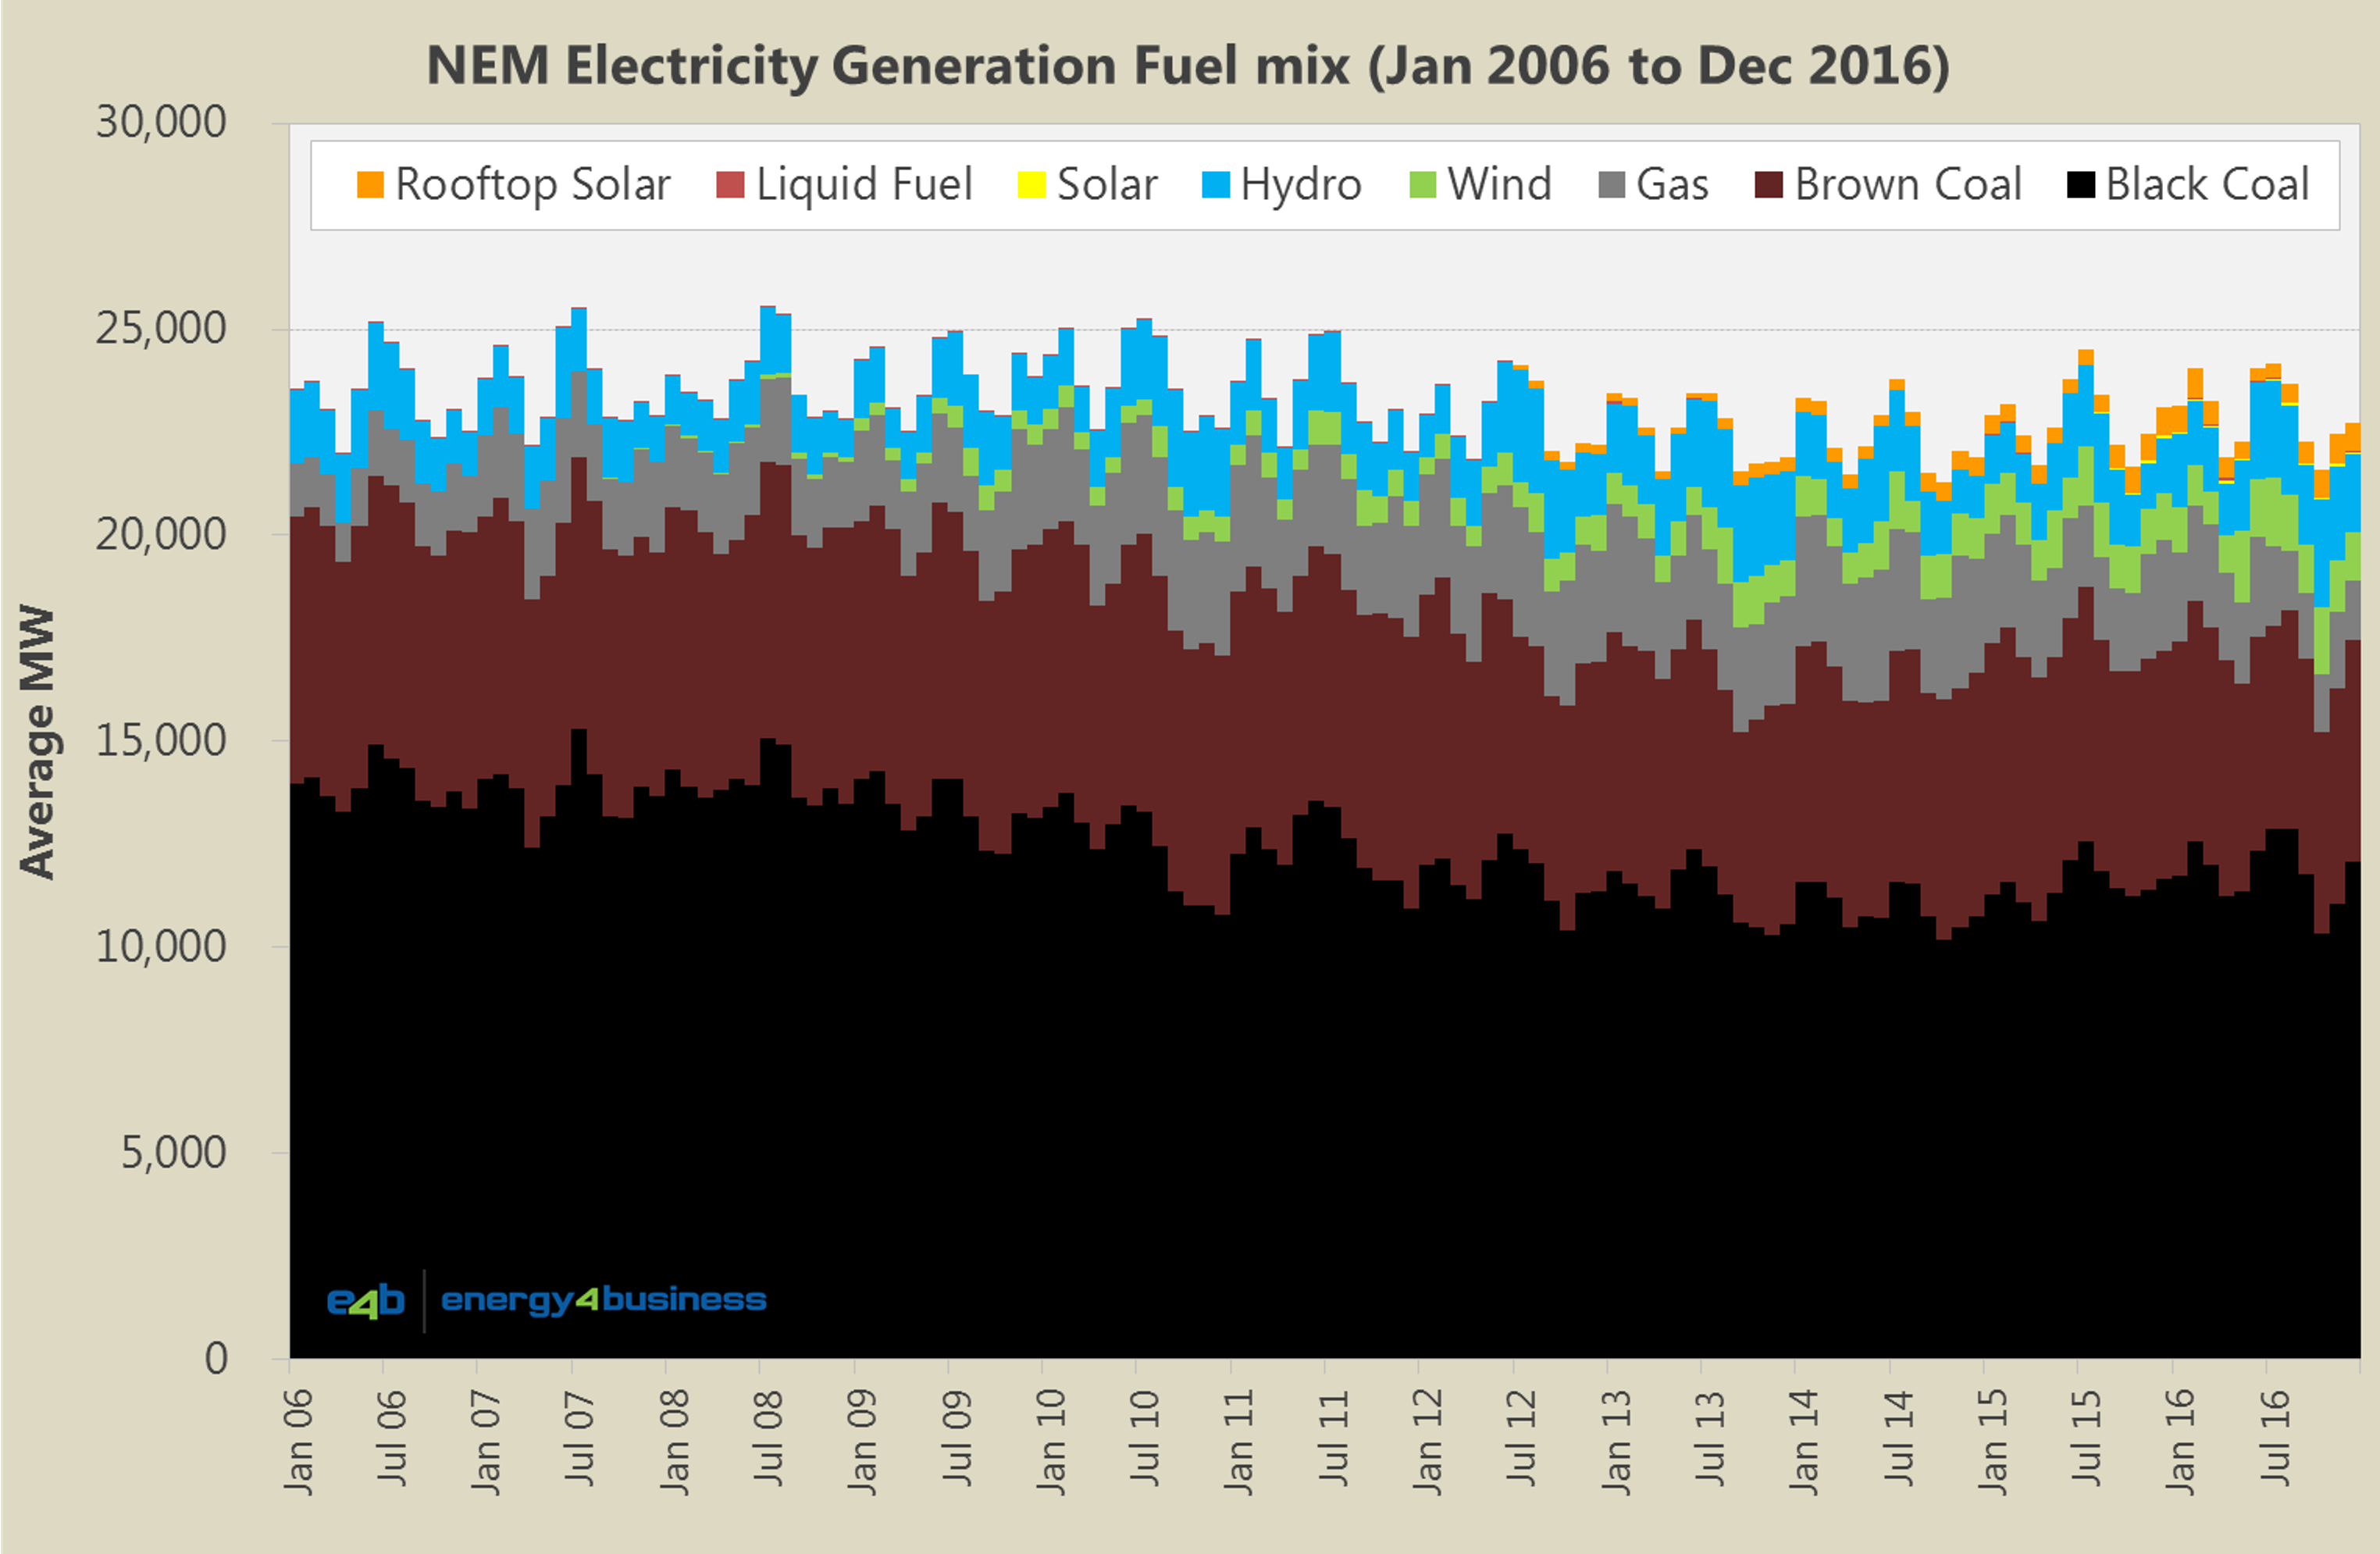
Over a decade ago in 2006, the National Electricity Market (NEM) regions of QLD, NSW, ACT, VIC, TAS & SA primarily relied upon electricity from the following fuel sources:
- Coal for 87% of its electricity, comprised of 60% black coal (NSW & QLD), and 27% brown coal (VIC & SA);
- Hydro power for 7%; and
- Natural gas fired generation for the remaining 6%.
Source data: AEMO, Creative Analytics, Australian PV Institute, e4b estimates.
Roll forward eleven years, and in the 12 months ending 31 December 2016, electricity demand in the NEM has declined and the market has evolved to incorporate a more diversified generation fuel mix:
- Black coal fired generation has dropped to 52%;
- Brown coal down to 23%
- Hydro and natural gas fired generation have both increased to 8.5% each;
- Renewable generation now supplies 8% of the market with 2.5% from solar and 5.5% from wind.
However, the power generation fuel mix varies significantly by region.
Tasmania remains the standout as the state with the lowest carbon emissions intensity of all NEM regions, largely due to its hydro-electric resource endowment. However, the state that has experienced the greatest green transition is South Australia.
Let’s take a look at the change in Australia’s power generation mix over time, state-by-state within the NEM.
South Australia
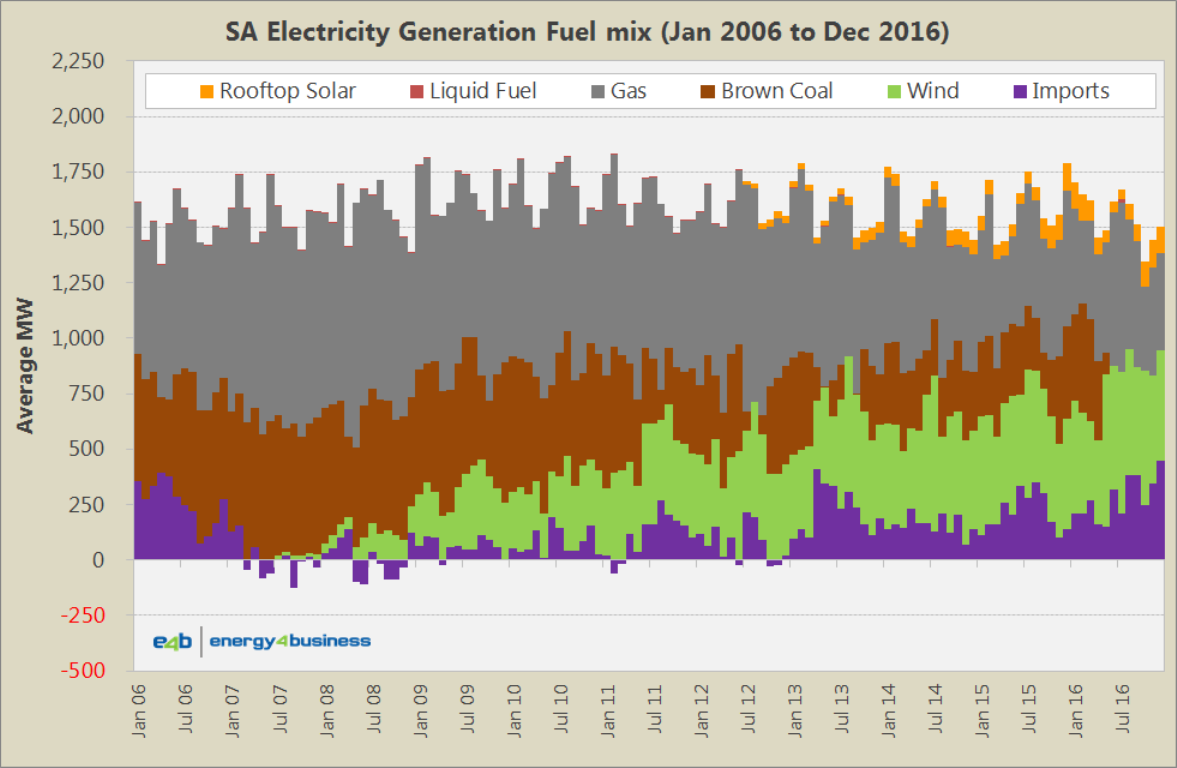
2007 saw the appearance and rapid growth of electricity generation from wind farms in South Australia.
In the prior year, 2006, SA primarily relied upon electricity from:
- Natural gas fired generation for 48% of its electricity;
- Port Augusta Power Stations (burning Leigh Creek brown-coal) for 36%; and
- Imports from Victoria for the remaining 17%.
Source data: AEMO, Creative Analytics, Australian PV Institute, e4b estimates.
Eleven years later and as at the end of 2016, SA’s mix has transformed to:
- Natural gas fired generation dropped to 33%;
- Brown coal down to 10% (and disappearing);
- Imports from Victoria at similar levels of 18% (note: months with negative import bars indicates that SA was a net exporter to VIC in that month); with
- Rooftop Solar PV now taking 5.6% share; and
- Wind farm generation up to 33%.
South Australia is now the only mainland NEM state without any coal-fired power generation, following the closure of the Leigh Creek Coal Mine in November 2015 and the Northern & Playford Power Stations at Port Augusta in May 2016.
As at December 2016, the carbon intensity of SA’s power generation sector is 0.3 tonnes of carbon dioxide equivalent per megawatt hour of electricity (0.3t CO2e/MWh) or approximately one third of the whole NEM average of 0.9t CO2e/MWh.
Queensland
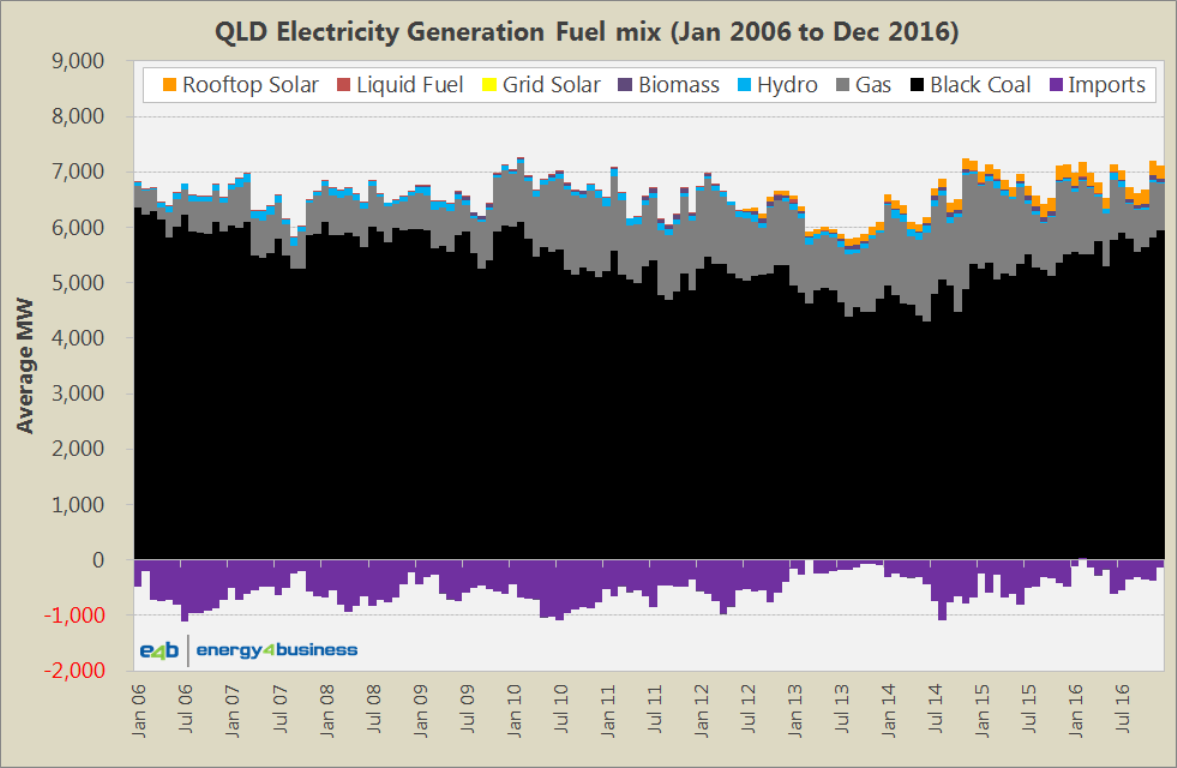
The major change observed in QLD over the past decade has been the growth in gas-fired generation, but QLD remains black-coal generation dominant and has remained a net exporter of electricity to its interconnected neighbour, NSW.
In 2006, QLD primarily relied upon electricity from:
Black coal fired generation for 104% of its electricity demand;
- Natural gas fired generation for 8%;
- Hydro-electric power for 1%; and
- QLD exported 13% of its generation to NSW.
Source data: AEMO, Creative Analytics, Australian PV Institute, e4b estimates.
In the past 12 months, QLD’s mix was:
- Black coal fired generation declined to 85%;
- Natural gas fired generation almost doubled to 14%;
- Hydro-electric power maintained 1%;
- QLD exports to NSW dropped to 4%;
- Solar PV is now taking over 3% share; and
- Biomass has picked up almost 1%.
The carbon intensity of QLD’s power generation sector in December 2016 is 0.9t CO2e/MWh on a par with the whole NEM average.
New South Wales
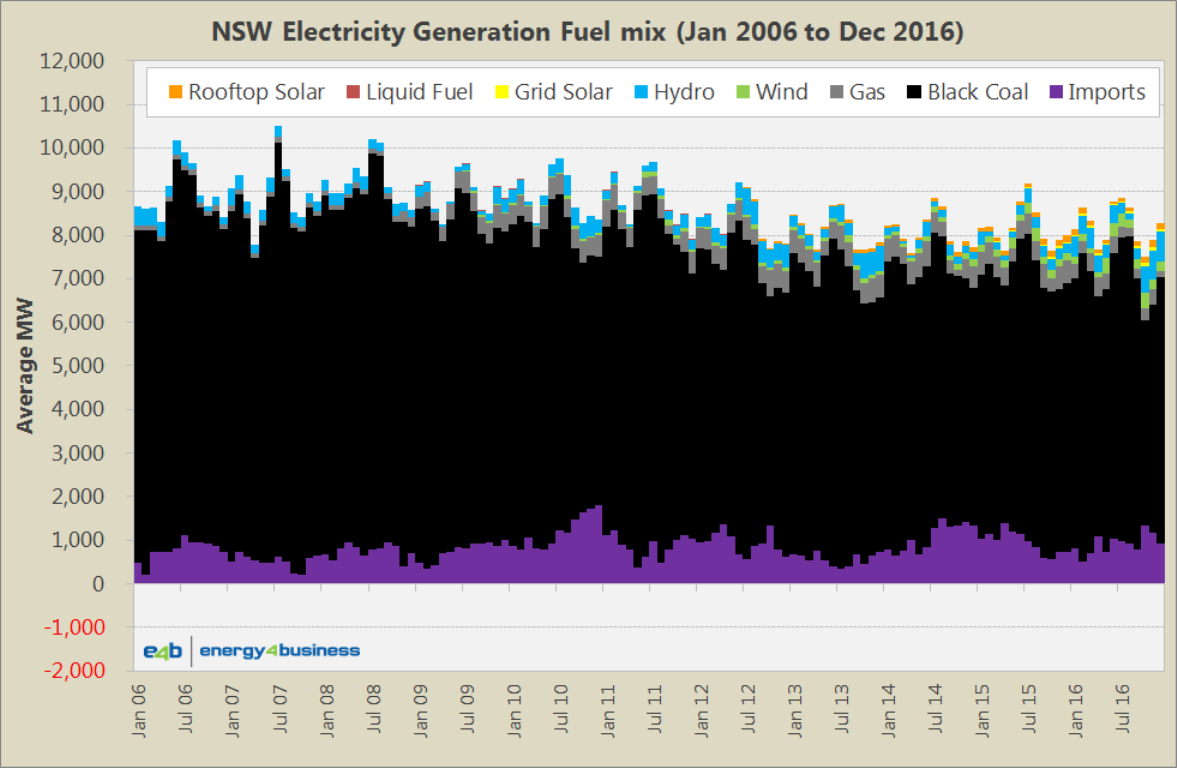
Like QLD, NSW remains black-coal generation dominant. NSW is interconnected to both QLD and VIC and remains a net importer of electricity. NSW has seen growth in gas generation, wind and solar. In terms of solar, NSW has large scale grid connected solar farms operating as well as “behind-the-meter” rooftop solar PV.In 2006, NSW primarily relied upon electricity from:
- Black coal fired generation for 88% of its electricity demand;
- Imports from QLD & VIC for 7%;
- Hydro-electric power for 3%; and
- Natural gas fired generation for 1%.
Source data: AEMO, Creative Analytics, Australian PV Institute, e4b estimates.
In the past 12 months, NSW’s mix was:
- Black coal fired generation declined to 75%;
- Imports increased to 11%;
- Gas fired generation increased to 4%;
- Hydro-electric power 5%;
- Wind power 3%; and
- Solar PV is now taking 2% share.
The carbon intensity of the NSW power generation sector in December 2016 is 0.86t CO2e/MWh which is approximately 4% below the whole NEM average of 0.9t CO2e/MWh.
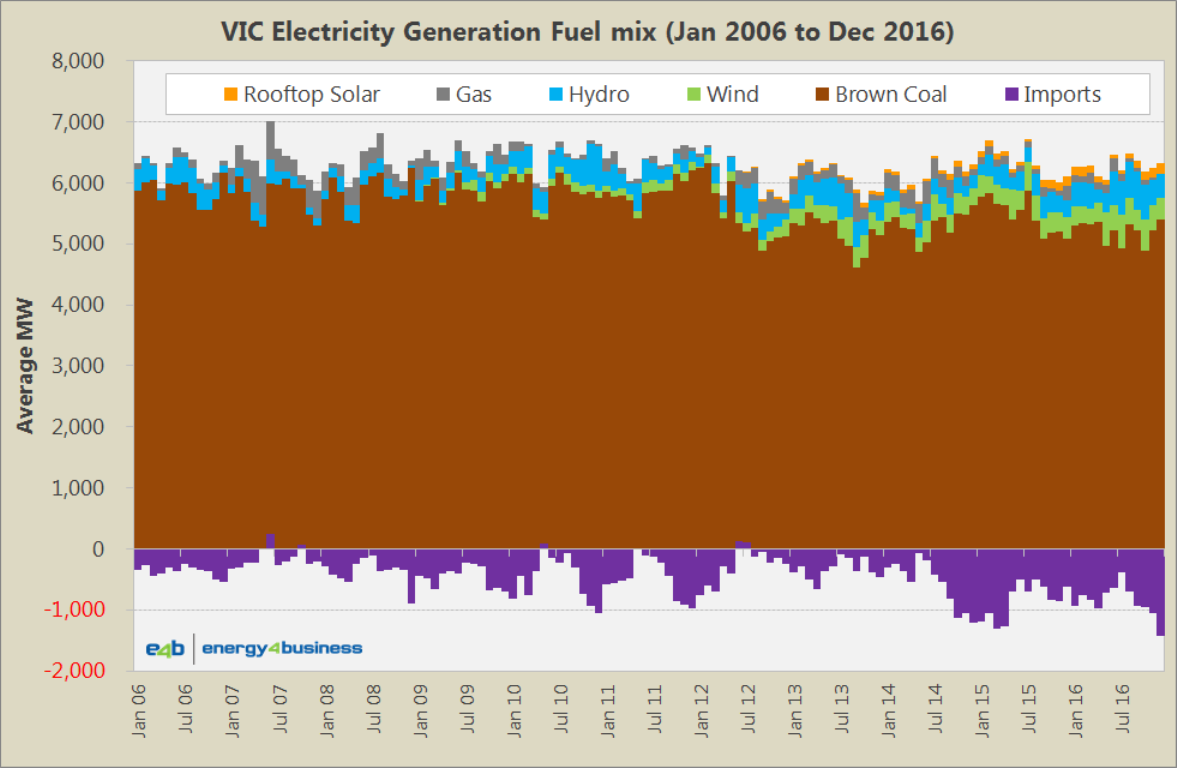
Victoria
Like QLD & NSW, VIC remains coal generation dominant, however, the primary fuel source in VIC is brown coal rather than black. VIC is interconnected to NSW, TAS & SA and is increasingly a net exporter of electricity. Those exports have increased since the removal of the carbon tax in July 2014 and had been somewhat lower through the 24 months of the carbon tax from July 2012 to June 2014.In 2006, VIC primarily relied upon electricity from:
- Brown coal fired generation for 99% of its electricity demand;
- Hydro-electric power for 5%;
- Natural gas fired generation for 2%; and
- VIC exported 6% of its generation to NSW, TAS & SA.
Source data: AEMO, Creative Analytics, Australian PV Institute, e4b estimates.
In the past 12 months, VIC’s mix was:
- Brown coal fired generation decreased to 96%;
- Gas fired generation was steady at 2%;
- Hydro-electric power was up at 8%;
- Wind power has grabbed 7%;
- Solar PV is now taking 2% share; and
- Exports have over doubled to 16%.
The carbon intensity of the VIC power generation sector in December 2016 is 1.2t CO2e/MWh or 32% above the whole NEM average of 0.9t CO2e/MWh.
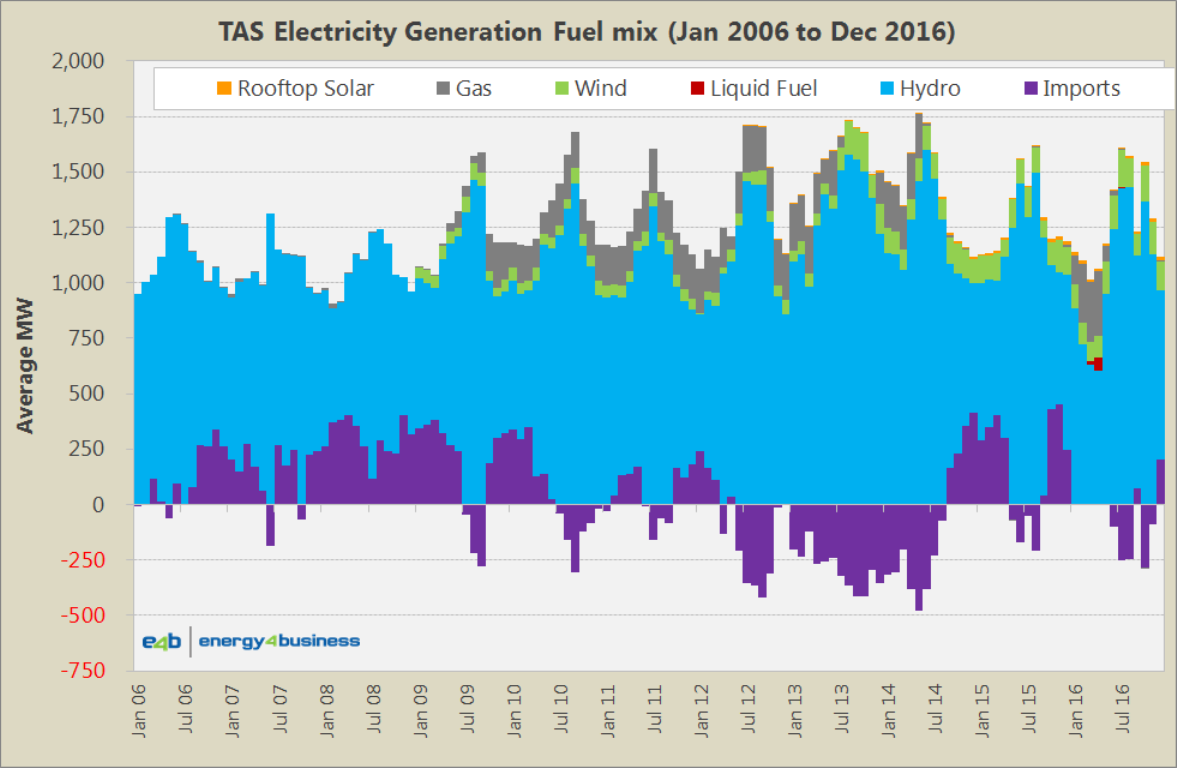
Tasmania
Tasmania’s electricity supply remains dominated by hydro-electric power and switches between net imports and net exports with VIC. Wind is also increasing its share in TAS. TAS is interconnected to VIC, and in the earlier part of the past decade TAS was a net importer from VIC. During the 2 years of the carbon tax, TAS was exclusively a net exporter to VIC on a monthly basis. In the first half of 2016 there were no imports to, or exports from, TAS due to the outage of the Basslink interconnector between VIC & TAS.
In 2006, TAS primarily relied upon electricity from:
- Imports from VIC for 10%.
- Hydro-electric power for 90%; and
Source data: AEMO, Creative Analytics, Australian PV Institute, e4b estimates.
In the past 12 months, TAS’s mix was:
- Hydro-electric power for 85%;
- Wind 11%;
- Gas 7%;
- Solar 1%;
- Liquid fuel for just under 1%; and
- TAS was a 5% next exporter over the year.
The carbon intensity of the TAS power generation sector in December 2016 was 0.0t CO2e/MWh compared to the whole NEM of 0.9t CO2e/MWh.
Power Generation and Carbon Dioxide Emissions Intensity
The following chart shows the weekly CO2 emissions reported by AEMO by NEM region from June 2011.
- TAS has the lowest emissions at close to zero, but had average levels around 1.3 tonnes CO2e/MWh during the Basslink outage in the first half of 2016.
- SA’s average emissions intensity has fallen 35% from 0.52 to 0.34 following the closure of the Augusta Power Stations in May 2016.
- NSW & QLD emissions remain at similar levels to the NEM average.
- VIC emissions remain at approximately 32% above the NEM average.
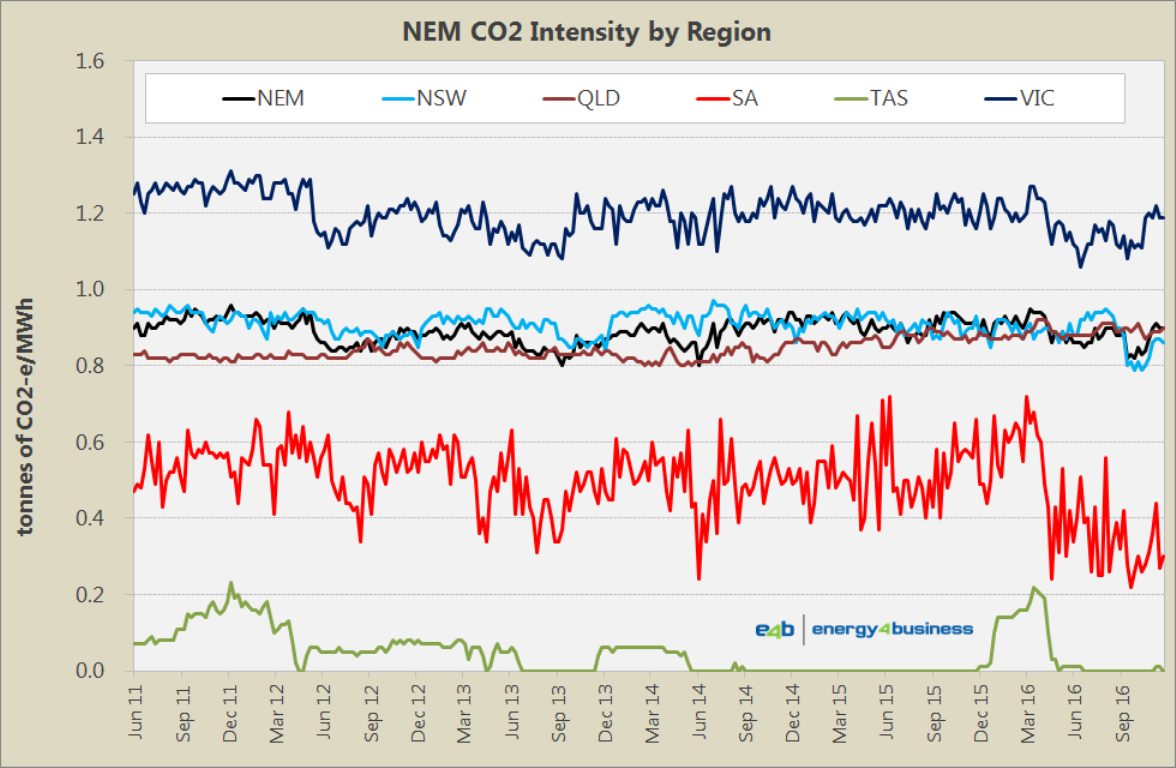
Source data: AEMO.